Chapter 27 - Instrumentation in Hematology
OBJECTIVES
Instrumental principles
■ Describe the basic theory of the electrical impedance principle of cell counting and sizing.
■ Describe the basic theory of the optical detection principle of cell counting and sizing.
■ Explain the fundamental concepts of laser technology.
■ Describe the principles of flow-cell cytometry and two basic uses of this technology in hematology.
Whole blood cell analysis
■ Define the terms parameter and sample.
■ List the parameters measured by basic bench-top hematology analyzers.
■ Describe the methods used to measure the parameters named in the preceding objective.
■ Name the parameters measured by total cell counting systems.
■ Defi ne the abbreviation RDW.
■ Describe the process and output of total cell and histogram electrical impedance systems.
■ Describe the process and output of a laser scatter technology system.
■ Compare the process and output of the continuous fl ow system to the other two types of total cell and differential cell counters.
■ Describe the general characteristics of histograms.
Analysis of instrumental data output
■ Describe the appearance of microcytic and macrocytic erythrocytes on a histogram.
■ Name two conditions that would contribute to a bimodal cellular distribution on an erythrocyte histogram.
■ Explain how the red cell distribution width (RDW) is calculated and give the normal range.
■ Describe the relationship of the RDW to the mean corpuscular volume (MCV).
■ Name the six classifi cations of erythrocytes based on the RDW and MCV.
■ Explain how the red cell mean index (RCMI) is calculated and give the normal value.
■ Describe the appearance of a leukocyte histogram generated by the electrical impedance method.
■ Describe the appearance of a leukocyte histogram generated by the optical detection method.
■ Describe the construction of a platelet histogram.
■ Explain how the mean platelet volume (MPV) is calculated.
■ Compare the relationship between MPV and the platelet count.
■ Name at least four disorders in which the MPV is abnormal.
■ Explain the purpose of the platelet distribution width (PDW) and its normal value.
Laser technology
■ Describe the generation, by laser technology, of a histogram for red blood cells (RBCs).
■ Explain how a platelet histogram is generated.
■ Describe the analysis and interpretation of the peroxidase analysis.
■ Explain the output of the basophil/lobularity channel.
■ Describe the process of lymphocyte subtyping.
Applications of fl ow cytometry
■ Describe the general functions that fl ow cytometry analysis can provide.
■ Name the three factors that have contributed to the rapid advance of the technology of fl ow cytometry.
■ Name and discuss three hematological applications of flow cytometry.
■ Name and discuss three other cellular applications of flow cytometry.
Digital Microscopy
■ Describe the function of artifi cial neural networks.
■ Explain the benefi ts and advantages of digital microscopy.
Single-purpose instrumentation
■ Explain the principles of a pattern recognition leukocyte differential analyzer.
Instruments in coagulation studies
■ Describe the two most common types of instruments used in the clinical laboratory for the detection of fi brin clots.
■ Explain the principles of electromechanical and optical detection systems.
■ Describe the methodological principle of platelet aggregation.
Case studies
■ Analyze and discuss the signifi cance of the erythrocyte and leukocyte histograms and the nomogram presented in the six case studies.
INSTRUMENTAL PRINCIPLES
Instrumentation and the automation of procedures continue to increase in the clinical hematology laboratory. Since the first Coulter Cell Counter Model A was introduced in the 1950s, the types of automated equipment and instrumental capabilities of instrumentation have become more diverse and sophisticated. Cell counting and automated differen tial analysis are now routinely found in most laboratories. Microprocessor applications have increased instrument programming capabilities and data output in ways that were unimagined a decade ago.
The counting of the cellular elements of the blood (erythrocytes, leukocytes, and platelets) can be based on one of two classic methods:
1. Electrical impedance
2. Optical detection
The Electrical Impedance Principle
This method of cell counting was originally developed by Coulter Electronics and is referred to as the Coulter principle. Cell counting and sizing are based on the detection and measurement of changes in electrical impedance (resistance) produced by a particle as it passes through a small aperture. Particles such as blood cells are nonconductive but are suspended in an electrically conductive diluent. As a dilute suspension of cells is drawn through the aperture, the passage of each individual cell momentarily increases the impedance (resistance) of the electrical path between two submerged electrodes that are located on each side of the aperture (Fig. 27.1). The number of pulses generated during a specifi c period is proportional to the number of particles or cells. The amplitude (magnitude) of the electrical pulse produced indicates the cell’s volume (Fig. 27.2). The output histogram is a display of the distribution of cell volume and frequency. Each pulse on thex-axis represents size in femtoliters (fL); they-axis represents the relative number of cells.


The Optical Detection Principle
In the optical or hydrodynamic focusing method of cell counting and cell sizing, laser light is used. A diluted blood specimen passes in a steady stream through which a beam of laser light is focused. As each cell passes through the sensing zone of the flow cell, it scatters the focused light. Scattered light is detected by a photodetector and converted into an electrical pulse. The number of pulses generated is directly proportional to the number of cells passing through thesensing zone in a specific period.
The application of light scatter means that as a single cell passes across a laser light beam, the light will be reflected and scattered. The patterns of scatter are measured at various angles (forward scatter 180°, and right angle 90°). Scattered light provides information about cell structure, shape, and reflectivity. These characteristics can be used to differentiate the various types of white blood cells (WBCs) and to produce scatter plots with a five-part differential.
Characteristics of Light Scatter
Optical Light Scatter
In this category, light amplification is generated by stimulated emission of radiation. Three independent processes are operational. These are:
1. Diffraction and the bending of light around corners with the use of small angles
2. Refraction and the bending of light because of a change in speed with the use of intermediate angles
3. Reflection and light rays turned back by the surface or an obstruction with the use of large angles
Angles of Light Scatter
Various angles of light scatter can aid in cellular analysis. These are:
1. Forward light scatter 0°. This is diffracted light, which relates to the volume of the cell.
2. Forward low-angle light scatter 2° to 3°. This characteristic can relate to size or volume.
3. Forward high angle 5° to 15°. This type of measurement allows for description of the refractive index of cellular components.
4. Orthogonal light scatter 90°. The result of this application of light scatter is the production of data based on reflection and refraction of internal components, which correlates with internal complexity.
Radio Frequency
In this newer application, high-voltage electromagnetic current is used to detect cell size, based on the cellular density. The radio frequency (RF) pulse is directly proportional to the nuclear size and density of a cell. RF or conductivity is related to the nuclear-cytoplasmic ratio, nuclear density, and cytoplasmic granulation.
Fundamentals of Laser Technology
In 1917, Albert Einstein speculated that under certain conditions atoms or molecules could absorb light or other radiation and then be stimulated to shed this gained energy. In the 1950s, physicists theorized how this borrowed energy could be multiplied and emitted in high quantities. A decade later, new lasers were developed and used in medical and industrial applications.
In 1917, Albert Einstein speculated that under certain conditions atoms or molecules could absorb light or other radiation and then be stimulated to shed this gained energy. In the 1950s, physicists theorized how this borrowed energy could be multiplied and emitted in high quantities. A decade later, new lasers were developed and used in medical and industrial applications.
The electromagnetic spectrum ranges from long radio waves to short, powerful gamma rays (Fig. 27.3). Within this spectrum is a narrow band of visible or white light, which is composed of red, orange, yellow, green, blue, and violet light. Light amplified by stimulated emission of radiation (laser) light ranges from the ultraviolet and infrared spectrum through all the colors of the rainbow.

In contrast to other diffuse forms of radiation, laser light is concentrated. Laser light is almost exclusively of one wavelength or color and its parallel waves travel in one direction. Through the use of fluorescent dyes, laser light can occur in numerous wavelengths. The types of lasers include glass-filled tubes of helium and neon lasers; the yttrium, aluminum, garnet (YAG) type, an imitation diamond; argon; or krypton.
Lasers sort the energy in atoms and molecules, concentrate it, and release it in powerful waves. In most lasers, a medium of gas, liquid, or crystal is energized by high-intensity light, an electrical discharge, or even nuclear radiation. When an atom extends beyond the orbits of its electrons or when a molecule vibrates or changes its shape, they instantly snap back, shedding energy in the form of a photon. The photon is the basic unit of all radiation. When a photon reaches an atom of the medium, the energy exchange stimulates the emission of another photon in the same wavelength and direction. This process continues until a cascade of growing energy sweeps through the medium.
Photons travel the length of the laser and bounce off mirrors. First a few and eventually countless photons synchronize themselves, until an avalanche of light streaks between the mirrors. In some gas lasers, transparent discs, referred to as Brewster windows, are slanted at a precise angle, which polarizes the laser’s light. The photons, which are reflected back and forth, finally gain so much energy that they exit as a powerful beam. The power of lasers to pass on energy and information is measured in watts.
Principles of Flow Cytometry
Laser light is the most common light source used in flow cytometers because of the properties of intensity, stability, and monochromatism. Flow cytometry is defined as the simultaneous measurement of multiple physical characteristics of a single cell as the cell flows in suspension through a measuring device. Flow cytometry combines the technologies of fluid dynamics, optics, lasers, computers, and fluorochrome-conjugated monoclonal antibodies that rapidly classify groups of cells with heterogeneous mixtures.
The principle of flow cytometry is based on the fact that cells are stained in suspension.Flow cytometry has specifically come to denote the use of fl uorescence measurement, usually with a laser light source. In laser flow cytometers, light scatter is used to measure the intrinsic size and granularity of the cell. In addition, fluorescence can be used to measure extrinsic features (e.g., specific protein expression and nucleic acid content) by adding reagents (e.g., fluorescent stains and antibodies). Virtually all flow cytometric assays use fluorescent stains. Fluorescent dyes used in flow cytometry must bind or react specifically with the cellular component of interest (e.g., reticulocytes, peroxidase enzyme, or DNA content). Fluorescent dyes include acridine orange, thioflavin T, pyronin Y, fluorescein isothiocyanate (FITC), and phycoerythrin (PE). FITC and PE are used when dual color analysis is desired.
Many flow cytometric assays use direct immunofluorescence staining with fluorochrome-conjugated monoclonal antibodies to identify cells expressing specific antigens. Fluorochromes are molecules that absorb light of one wavelength and emit light of a higher wavelength. Fluorochromes are covalently bonded to monoclonal antibody molecules. This provides a mechanism that allows for the determination by the flow cytometer if a labeled antibody has bound to the cell surface.
An argon laser, which produces blue light, is the most commonly used laser. Some instruments add a red helium-neon laser and occasionally a mercury arc lamp is substituted. Each fluorochrome has a maximal excitation wavelength at or near the wavelength of the laser and has a characteristic emission spectrum. The fluorochrome, excited by the laser light, will fluoresce at a longer wavelength. Fluorescein emits a green fluorescence, PE emits orange, and peridinin chlorophyll protein or PE coupled to cyanin 5 emits a red fluorescence.
Some flow cytometers have a second laser that can excite other fluorochromes. Like the side-scattered blue light, all of these fluorescent signals pass through the objective set at 90° to the incident laser light. The number of colors in flow cytometry output refers to the number of individual fluorochrome-labeled antibodies used simultaneously in a given reaction tube. For example, mixing a cell suspension with a combination of antibodies labeled with two fluorochromes is referred to two-color flow cytometry.
A suspension of stained cells is pressurized using gas and transported through plastic tubing to a quarts flow chamber (Fig. 27.4) within the instrument. In the flow chamber, the specimen is injected through a needle into a stream of physiological saline solution called the sheath. The sheath and specimen both exit the flow chamber through a 75-mm orifice. This laminar flow design confines the cells to the very center of the saline sheath with the cells moving in single file. The stained cells next pass through the laser beam. The laser activates the dye and the cell fluoresces. The interaction between each cell and the laser beam provides the following two types of information:
1. The amount of light scattered by each cell hit by the laser beam
2. The intensity of the fluorescence emitted by labeled antibodies bound to antigens on the different types of suspended cells

Although the fluorescence is emitted throughout a 360° circle, it is usually collected via optical sensors located at 90° relative to the laser beam. The fluorescence information is then transmitted to a computer. Flow cytometry performs fluorescence analysis on single cells at rates up to 50,000 cells/minutes. The computer is the heart of the instrument; it controls all decisions regarding data collection, analysis, and cell sorting.
The Basis of Cellular Identifi cation
One of the major advantages of flow cytometry is that more than one measurement can be made on every cell during the few milliseconds that the cell spends passing through the laser beam. Each cell can be optically measured for the intensity of scattered light.
The cellular light scatter patterns can be used to identify cells. Both intrinsic and extrinsic properties of cells can be analyzed by flow cytometry. Intrinsic properties include forward- and right-angle light scatter, which correlate with size and granularity of a cell, respectively. This data output does not require addition of dyes or stains for detection. In contrast, extrinsic properties rely on the binding of various probes to the cells. The scattered light passes through a variety of filters and lenses and is then measured by photomultiplier tubes, which convert the light signals into electronic signals for computer analysis. Light scattered along the axis of the laser beam is “forward scatter,” and light scattered perpendicular to the axis is “side scatter” or “orthogonal scatter.” Forward scatter is roughly proportional to cell size; side scatter to cytoplasmic granularity. Granulocytes have a much larger side-scattered light signal than do lymphocytes.
Data Analysis
Data are plotted on histograms. Populations of similar cells form discrete and characteristic two-dimensional “clusters” of scatter when the forward and side scatters are plotted against each other.
Most hematological samples contain multiple cell populations. It is necessary to first identify the population of interest for further analysis. Whole blood is commonly used for platelet and erythrocyte assays. Data collected by the flow cytometer can be displayed as a 1-parameter histogram or as 2-parameter plots. A 1-parameter histogram is described as either the percentage of cells within a set of markers or as the mean fluorescent intensity of a population. A 2-parameter plot is usually divided into four quadrants, each containing a percentage of the total population. This is used to distinguish between fluorescent and nonfluorescent cells. It also defines the expression and nonexpression of a cell molecule marked by a fluorescent antibody or other fluorochrome. It is often necessary to analyze a single population within several populations and debris.
Electronic gating allows isolation of a specific cluster of cells for analysis. Gating is a software feature used to restrict analysis to a particular population. A gate is created by drawing a graphic boundary (Fig. 27.5) around a population of cells.

Quadrant markers divide 2-parameter plots into four sections called quadrants. The quadrants are used to distinguish negative, single-positive, and double-positive populations from one another (Fig. 27.6). A negative population is located in the lower left (LL) quadrant.

WHOLE BLOOD CELL ANALYSIS
Clinical laboratory automation has been evolving rapidly during the past 40 years. A significant innovation is automated front-end (preanalytical [preexamination]) instrumentation/robotics and total work cells linked by a track or conveyor. Because specimen processing is perhaps the most labor-intensive portion of the testing process, automating this preanalytical (preexamination) process is one option for streamlining procedures to reach maximum efficiency and to improve customer service. The critical workload volume to reach to invest in front-end automation is between 1,500 and 2,000 specimens per day.
Clinical laboratory automation has been evolving rapidly during the past 40 years. A significant innovation is automated front-end (preanalytical [preexamination]) instrumentation/robotics and total work cells linked by a track or conveyor. Because specimen processing is perhaps the most labor-intensive portion of the testing process, automating this preanalytical (preexamination) process is one option for streamlining procedures to reach maximum efficiency and to improve customer service. The critical workload volume to reach to invest in front-end automation is between 1,500 and 2,000 specimens per day.
Automated analyzers now form the backbone of clinical laboratories both large and small. Smaller analyzers are commonly used in STAT labs, freestanding clinics, physicians’ offices, and small hospital laboratories. Larger and more complex systems are used in larger clinical and research laboratories.
The degree of instrumental sophistication is frequently described by the number of parameters that the instrument generates. The term parameter is a statistical term that refers to any numerical value that describes an entire population. Parameter should be clearly distinguished from the term sample, which is a subset of a population. Any numerical value describing a sample is called a statistic.
The smaller hematology instruments measure erythrocytes (RBCs), leukocytes (WBCs), and platelets. Entry-level hematology instruments generate eight measured or calculated parameters (WBC, RBC, hemoglobin [Hgb], hematocrit [Hct], MCV, mean corpuscular hemoglobin [MCH], mean corpuscular hemoglobin concentration [MCHC], and platelets). Computerized systems generally flag high or low patient results. These systems are automated from sample aspiration through result printout (Fig. 27.7). Additional basic parameters include erythrocyte morphology information expressed as RDW, MPV, or leukocyte histogram differential. Other calculated output is expressed differently, depending on the manufacturer (Table 27.1).


Technology continues to deliver new automation capabilities in hematology. For example, automated reticulocyte counting was a leading edge technology a few years ago but is a routinely measured parameter in many clinical laboratories today. Some of the latest instruments prepare and stain peripheral blood smears and automatically correct for leukocyte (WBC) interference. Newly developed instrumental capabilities continue to be developed. Some of the innovations include ■ Quantitation of nucleated erythrocyte (NRBC) counts
■ A channel for enumeration of immature granulocytes (IGs)
■ Random access CD4 lymphocyte counting
■ Analysis for CD34, CD38, and CD61 cell markers
■ Measurement of reticulocyte hemoglobin
■ Enumeration of hematopoietic progenitor cells (HPCs)
■ Counting of IGs
■ A channel for enumeration of immature granulocytes (IGs)
■ Random access CD4 lymphocyte counting
■ Analysis for CD34, CD38, and CD61 cell markers
■ Measurement of reticulocyte hemoglobin
■ Enumeration of hematopoietic progenitor cells (HPCs)
■ Counting of IGs
Types of Automated Cell Counting Instruments
Major types of automation are representative of the ways that blood cells can be counted, leukocytes differentiated, and other components (e.g., MCH and MCHC) calculated. Hemoglobin is measured by the traditional cyanmethemoglobin flow-cell method at 525 and 546 nm, depending on the instrument manufacturer. A summary of currently marketed automated instruments is shown in Tables 27.2 to 27.4. Models and features of instrumentation change rapidly. The reader is advised to refer to the respective manufacturers’ Web sites for any updates.


Cell-Dyn Series (http://www.abbott.com)
The basic system uses multiangle polarized scatter separation (MAPSS) flow cytometry with hydrodynamic focusing of the cell stream is universal to Abbott five-part differential analyzers. The CELL-DYN Sapphire is the most advanced of the CELL-DYN analyzers. These analyzers feature dual leukocyte counting methods. The leukocyte differential without the use of a stain is accomplished with light scatter with 0°, 90°, 10°, and 90° (depolarized) as well as nuclear optical count by light scatter at 0° and 10°. In addition, the CELL-DYN Sapphire uses three color fluorescence measurements made on cells that are stained with fluorochromes dyes: FL1 (green, 515 to 545 nm), FL2 (yellow, 565 to 595 nm), and FL3 (red, 615 to 645 nm). The CELL-DYN Ruby does not employ fluorescence analysis. This mode uses a more economical, red (632.8 nm) wavelength laser for MAPSS analysis.
The basic system uses multiangle polarized scatter separation (MAPSS) flow cytometry with hydrodynamic focusing of the cell stream is universal to Abbott five-part differential analyzers. The CELL-DYN Sapphire is the most advanced of the CELL-DYN analyzers. These analyzers feature dual leukocyte counting methods. The leukocyte differential without the use of a stain is accomplished with light scatter with 0°, 90°, 10°, and 90° (depolarized) as well as nuclear optical count by light scatter at 0° and 10°. In addition, the CELL-DYN Sapphire uses three color fluorescence measurements made on cells that are stained with fluorochromes dyes: FL1 (green, 515 to 545 nm), FL2 (yellow, 565 to 595 nm), and FL3 (red, 615 to 645 nm). The CELL-DYN Ruby does not employ fluorescence analysis. This mode uses a more economical, red (632.8 nm) wavelength laser for MAPSS analysis.
Erythrocytes and platelets are counted by light scatter at 0° and 10°. Red cell indices (MCV, MCH, MCHC) are generated. Mature reticulocytes and immature reticulocyte fraction (IRF) are measured and reported.
A unique feature is cyanide-free hemoglobinometry. Rapid cell lysis followed by the formation of an imidazolehemoglobin complex is measured. The HB Flow Cell is illuminated by a light-emitting diode (LED) and a photodetector measures transmitted light at 540 nm.
In addition, the Cell-Dyn 4000 incorporates the technologies used in the basic model and features three independent measurements and focused flow impedance. A hydrodynamically focused impedance method is employed for primary erythrocyte counts, secondary platelet counts, and erythrocyte and platelet size distribution analysis.
Multidimensional light scatter and fluorescent detection are used as well. DNA and RNA fluorescence are used to distinguish NRBCs from viable and nonviable leukocytes (WBCs). RNA fl uorescence can measure reticulocytes and the IRF.
Horiba ABX Diagnostics, Inc. (http://www.adx.com)
The Pentra 60C+ is a small bench-top instrument. It reports 20 parameters and RBC, platelets (PLT), and basophil (BASO) histograms. Two patented methodologies are used.
Siemens Healthcare Diagnostics (http:www/medical.siemens.com)
The ADVIA series uses two separate and independent flow cytometers to count and identify cells. This technology uses unifluidics, a darkfield optical method. Once a specimen is aspirated, it is delivered into a ceramic shear valve, where it is divided into separate aliquots for analysis in various reaction chambers. Dual leukocyte methods of peroxidase staining and basophil lobularity are used. Erythrocytes and platelets are counted in the RBC reaction chamber by flow cytometry. Hemoglobin has dual readings and colorimetric or cyanmethemoglobin and corpuscular hemoglobin concentration mean.
Reticulocyte enumeration using oxazine 750 stain is determined by low-angle light scatter, high-angle light scatter, and absorption measurements as the aliquot of specimen travels through the reticulocyte reaction chamber. The low-angle scatter and high-angle scatter are proportional to cell size and hemoglobin concentration. The light absorption measurement is proportional to ribonucleic acid (RNA) content because stained reticulocytes absorb more light than mature erythrocytes. The output of these three parameters is plotted on a reticulocyte volume histogram, on a hemoglobin concentration histogram, and on the reticulocyte hemoglobin content histogram. The reticulocyte hemoglobin content (CHr) demonstrates the functional state of erythropoiesis. CHr is an important indicator of asymptomatic anemia, which is particularly important in children under the age of 2 years and pregnant women. The reference range is 0 to 200 fL.
Two separate methods are used by the ADVIA 120/2120 system to analyze WBCs. The total WBC count is measured from two reaction chambers: the peroxidase chamber and the lobularity/nuclear density chamber. In the peroxidase chamber, WBCs are fixed and peroxidase reagent is used. This chamber is heated to a high temperature to lyse RBCs and platelets and to fix the WBCs. The WBC size is measured by forward angle laser light scatter. Peroxidase activity is measured by tungsten light optics. Myeloperoxidase is a granulocyte enzyme marker. Data are displated on a PEROX cytogram with light absorption depicted on the x-axis and forward scatter on the y-axis. In the lobularity/nuclear density reaction chamber, an aliquot of whole blood is introduced into an acid buffer that selectively lyses the cytoplasm of all cells, except basophils. Samples flow through a laser
light path, where low-angle scatter and high-angle scatter are measured. Basophils are not lysed and appear larger, scatter more light, and appear higher on the vertical axis of a scattergram compared to the bare nuclei of other WBCs. A primary WBC count and basophil count are generated from this channel.
Data generated by the ADVIA system indicate relative percentages and absolute values for granulocytes (neutrophils, eosinophils, basophils), lymphocytes, and monocytes. In addition, interpretative data to signal the presence of abnormalities in the sample are generated as well as the percentage of large unstained cells (LUCs). An increased number of LUCs suggests the presence of variant lymphocytes or blast cells.
Body fluid analysis, for example, cerebrospinal fluid (CSF) can be analyzed for RBCs and WBCs. Cells are counted and differentiated on three optical measurements: low angle scatter, high angle scatter, and absorbance. These data points, and the percentage and absolute values for mononuclear
cells PMNs, lymphocytes, and monocytes are generated.
cells PMNs, lymphocytes, and monocytes are generated.
Beckman-Coulter (http://www.beckmancoulter.com)
The latest generation of Beckman Coulter (the LH Series) is a fully automated complete blood count (CBC) and differential analyzer. The use of the Beckman Coulter AccuCount technologies, the Coulter Principle, and VCS (see Box 27.1) technologies delivers expanded productivity and advances
in cellular flow analysis of individual cells. These applications allow for nucleated red blood cells (NRBCs) counts with a corrected total leukocyte (WBC) count, correction for WBC interference, and the ability to analyze body fluids, for example, CSF. If the analyzer and work cells are combined, many of the pre-evaluation and post-evaluation steps are automated.
A second Beckman Coulter technology, AccuGate, uses a gating method to separate WBCs or RBCS and reticulocytes by using contour gates around cell populations. Leukocyte analysis is performed in three dimensions and is displayed as a 3D cube. Individual cells are represented as points on a scatterplot reflecting cell volume, conductivity, and laser light scatter characteristics. Reticulocytes is conducted by combining traditional supravital staining with new methylene blue stain and flow cytometry using VCS technology. NRBC is performed using the proprietary VCS technology.
A third technology, AccuFlex, allows end-users to optimize the levels of individual flags for improved data point performance. Contour discriminators examine areas between different cell populations. Flagging messages identify the type of cell population (e.g., WBC), the suspected variation (e.g., variant lymphocytes), and cell date of related condition (e.g., abnormal WBC population). A definitive condition, for example, leucopenia or leukocytosis, is also generated.
BOX 27.1
VCS Technology
Volume (V): using direct current impedance, the volume of each cell is measured.
Conductivity (C): radiofrequency penetrate the cell which generates the data points of cell size and cell internal structure.
Scatter (S): mid-angle scatter detected by a beam of laser light which generates data about cellular granularity and cell surface structure.
VCS: single channel that analyzes approximately 8,000 cells in a near-native condition.
Sysmex (http://www.sysmex.com)
In the Sysmex X series, there are four modes of sample introduction:
1. Sampler mode
2. Manual mode
3. Manual closed mode
4. Capillary mode
In the Sysmex X series, there are four modes of sample introduction:
1. Sampler mode
2. Manual mode
3. Manual closed mode
4. Capillary mode
The Sampler mode is the primary mode of peration. This mode automatically mixes, aspirates, and analyzes samples with removing the rubber stopper of an evacuated tube filled with anticoagulated blood. In Manual mode, the most commonly used method for STAT assay, the rubber stopper of an evacuated tube filled with anticoagulated blood, is manually removed, and the individual blood sample is aspirated with a pipet. Using the Manual closed mode, the sampler is used to aspirate a specimen of anticoagulated whole blood without removing the rubber stopper of an evacuated tube. The Manual closed mode is essentially the same as the Sampler mode, but mixing and continuous analysis cannot be performed automatically. The Capillary mode is used to analyze a very small sample of whole blood that has been diluted 1:5.
The XS series of Sysmex instruments are automated hematology systems consisting of two units: the Main Unit that aspirates, dilutes, mixes, and analyzes anticoagulated whole blood specimens and the IPU that processes data from the Main Unit and provides an operator interface. Flags and error messages alert laboratory personnel to specimen abnormalities.
Red cell distribution width, an expression of anisocytosis, is reported as RDW-SD and RDW-CV. The RDW-SD is an actual measurement of the width of the RBC histogram The RDW-CV, by comparison, is a mathematically derived parameter. The RDW-CV is dependent on the average size of the RBCs or the MCV. Some models produce nucleated RBC and reticulocyte counts. Reticulocytes are enumerated by fluorescent flow cytometry using laser light and a nucleic acid fluorescent dye. Results are reported as RBC-O (optical) and reticulocyte number (RET#), and reticulocytes percent (RET%). Reticulocyte maturation can be assessed. The RETHe or reticulocyte hemoglobin equivalent is used to monitor the availability of iron in RBCs.
Hemoglobin is measured using sodium lauryl sulfate (SLShemoglobin method), a noncyanide compound.
In the Sysmex series, erythrocytes and platelets are analyzed by
■ Hydrodynamic focusing
■ Direct current (DC)
■ Automatic discrimination
■ Hydrodynamic focusing
■ Direct current (DC)
■ Automatic discrimination
The leukocyte count is analyzed by the DC detection method and automatic discrimination. A five-part differential is produced for leukocytes by a differential detector channel (analyzed by RF and DC). A differential scattergram and an immature myeloid information (IMI) scattergram are produced by fluorescent flow cytometry. Each cell is measured by forward-scatter laser light, lateral-scatter laser light, and lateral fluorescent light.
Three additional parameters can be performed on the XE-2100 analyzer. These are IG, immature platelet fraction (IPF), and hematopoietic progenitor cell (HPC).
RBC and WBC cell counts can be performed on body fluids, including CSF, serous fluid, and synovial fluid.
Instrument Data Output
Flags or messages are generated if abnormal results are generated. Different cell types are distinguished electronically by impedance by the pulses they generate. The pulses that are generated are sorted according to size. These individual pulses appear on the oscilloscope and are categorized by the computer. From the WBC histogram, the percent and absolute number of lymphocytes, mononuclear cells, and granulocytes are determined. Each channel on the x-axis represents size increasing by 1 fL (1 fL = 1 mm3) from left to right. Each division on the y-axis represents one in that channel, providing the relative number of cells (Fig. 27.8).

Quality Control of Output Data
The Joint Commission, College of American Pathologists (ISO 15189 CAP), and the Clinical laboratory Improvement Amendments require a quality assurance/quality control system. A variety of quality control methods are available via computerized programming. These include instrument checks that ensure that the background is acceptably low and confirm the calibration stability of the electronic system. Control specimen data can be monitored with the generation of a Levey-Jennings graph for each parameter.
Patient results can be monitored with continuous XB analysis (weighted moving averages), which uses the patient’s own data to monitor population values and instrument performance. Batches of 20 samples are used to track MCV, MCH, and MCHC values. This method can be used to detect changes in sample handling, reagents, or instrument performance.
Delta checks are another quality control method for comparing a patient’s own leukocyte, hemoglobin, MCV, and platelet values with previous results. If the difference between the two is greater than laboratory-set limits, the current result is immediately flagged for review.
General Histogram Characteristics
Histograms are graphic representations of cell frequencies versus sizes. In a homogeneous cell population, the curve assumes a symmetrical bell-shaped or Gaussian distribution. A wide or more flattened curve is seen when the standard deviation (SD) from the mean is increased. Histograms not only provide information about erythrocyte, leukocyte, and platelet frequency and their distribution about the mean, but also depict the presence of subpopulations.
Histograms are graphic representations of cell frequencies versus sizes. In a homogeneous cell population, the curve assumes a symmetrical bell-shaped or Gaussian distribution. A wide or more flattened curve is seen when the standard deviation (SD) from the mean is increased. Histograms not only provide information about erythrocyte, leukocyte, and platelet frequency and their distribution about the mean, but also depict the presence of subpopulations.
Histograms provide a means of comparing the sizes of a patient’s cells with those of normal population’s. Shifts in one direction or the other can be of diagnostic importance. The position of the curve on the x-axis reflects the cell size. In the Coulter system, the size (volume in femtoliters) is represented on the x-axis.
ANALYSIS OF INSTRUMENTAL DATA OUTPUT
The Erythrocyte Histogram
The erythrocyte histogram reflects the native size of erythrocytes or any other particles in the erythrocyte size range. The erythrocyte histogram in the Coulter system displays cells as small as 24 fL, but only those greater than 36 fL are counted as erythrocytes. The extension of the lower end of the scale from 36 to 24 fL allows for the detection of erythrocyte fragments, leukocyte fragments, and large platelets.
Although normal quantities of leukocytes are present in the erythrocyte bath and are included in the erythrocyte count, they are not signifi cant in the histogram. The system can be calibrated to compensate for 7.5 × 10⁹/L leukocytes. If the leukocyte count is significantly elevated, the histogram will be affected.
If the cells are larger than normal, the histogram curve will be more to the right, as in the megaloblastic anemias. If the cells are smaller than normal, the curve will be more to the left (Fig. 27.9), as in untreated iron deficiency anemia. After appropriate treatment of the underlying cause of an anemia, the curve should move toward the normal range.
If the normal unimodal distribution is altered, the early stages of an underlying disorder may be revealed. A histogram distribution that is bimodal can be seen in various situations, including cold agglutinin disease, after the transfusion of normal erythrocytes into a person with abnormally sized erythrocytes, in the presence of erythrocyte fragments, or with agglutination.

An expression of erythrocyte size is the RDW in the Coulter series. This term refers to variation in erythrocyte size. Correlations between the RDW and the MCV exist for various types of anemias. A classifi cation of erythrocyte populations has been proposed based on the similarities or dissimilarities in the erythrocyte population and in the RDW and MCV.
Red Cell Distribution Width
A new parameter, the RDW, expresses the coefficient of variation of the erythrocyte volume distribution. It is calculated directly from the histogram. A portion of the curve (Fig. 27.10) at the extreme ends is excluded from the computation to exclude clumps of platelets, large platelets, or electrical interference on the left side of the curve. The portion of the right side of the curve that is excluded represents grouped or clumped erythrocytes.

The RDW is calculated by dividing the SD by the mean of the red cell size distribution.

The RDW is expressed numerically as the coefficient of variation percentage. The normal range is 11.5% to 14.5%. Abnormalities can be observed on the high side but no abnormalities have been noted on the low side. The RDW is increased above the normal limits in iron deficiency, vitamin B12 deficiency, and folic acid deficiency. In the hemoglobinopathies, the RDW is increased in proportion to the degree of anemia that accompanies the hemoglobin disorder.
Relationship of RDW and MCV
Quantitative descriptors of erythrocyte size include both the RDW and the conventional erythrocyte index, the MCV. The RDW is independent of high, low, or normal MCV and is an earlier sign of nutritional deficiency than the MCV. The relationship of the RDW and MCV can characterize various
erythrocytic abnormalities (Table 27.5).
The MCV of a specimen is calculated using the entire area under the erythrocyte curve. Because the RDW is a mathematical ratio, patients with an increased MCV may have a wide or heterogeneous distribution curve and a normal RDW. Patients with a low MCV may have a distribution curve with a normal (homogeneous) width, which produces a high RDW. A particularly valuable distinction based on the RDW is one between iron deficiency anemia (high RDW and either low or normal MCV) and anemia of chronic disease (normal RDW and normal or low MCV).

Classification of Erythrocytes Based on MCV and RDW
As long as the red cell volume distribution histogram is unimodal, erythrocyte size is described efficiently by the mean (MCV) and coefficient of variation (RDW). An increased RDW may occur with a low MCV even when the width of the curve is normal.
As long as the red cell volume distribution histogram is unimodal, erythrocyte size is described efficiently by the mean (MCV) and coefficient of variation (RDW). An increased RDW may occur with a low MCV even when the width of the curve is normal.
Erythrocytes with a normal RDW are homogeneous in character and exhibit very little anisocytosis on a peripheral blood smear. Erythrocytes with an increased RDW are referred to as heterogeneous and exhibit a high degree of anisocytosis on a peripheral blood smear. A classification of erythrocytes that includes the homogeneity or heterogeneity of the erythrocytes in addition to the MCV and RDW values has been proposed (Table 27.6).

The Leukocyte Histogram
Size-referenced leukocyte histograms display the classification of leukocytes according to size following lysis. It does not display the native cell size. The lytic reagent causes a cytochemical reaction. As a result of the reaction, the cytoplasm collapses around the nucleus, producing differential shrinkage. Therefore, the histogram of leukocyte subpopulations reflects the sorting of these cells by their relative size, which is primarily related to their nuclear size.
Size-referenced leukocyte histograms display the classification of leukocytes according to size following lysis. It does not display the native cell size. The lytic reagent causes a cytochemical reaction. As a result of the reaction, the cytoplasm collapses around the nucleus, producing differential shrinkage. Therefore, the histogram of leukocyte subpopulations reflects the sorting of these cells by their relative size, which is primarily related to their nuclear size.
The Coulter models system classifies approximately 20,000 particles when the leukocyte count is at the 10.0 × 10³ cells/mL level. As the leukocytes pass through the aperture in the electrical impedance system, they displace their volume in a conductive fluid, which causes a change in electrical resistance as each cell passes through the aperture. This change is proportional to the cell volume. The histogram generated by the Coulter principle provides size information.
Although the Coulter leukocyte histogram displays all cells as small as 30 fL, only those greater than 35 fL are counted as leukocytes. The histogram differentiates lymphocytes, mononuclear cells, and granulocytes (Fig. 27.11). Mononuclear cells include blasts or other immature cells, such as promyelocytes and myelocytes, as well as monocytes; however, in a normal specimen, monocytes represent the mononuclear cells.

On the x-axis of the histogram, four regions are noted at approximately 35, 90, 160, and 450 fL. There are certain expected characteristics of the curves at these locations. A valley or depression should be seen between the lymphocytes and mononuclear cells and between the mononuclear cells and granulocytes.
The computer program uses these locations to determine the three populations; however, each differential analysis is individualized to determine the position of the populations in each specimen. Leukocytes normally occur at 35 fL or above; the region below 35 fL should be clear. Particles such as clumped or giant platelets, NRBCs, and nonlysed erythrocytes might produce interference at or below 35 fL.
The instrument detects abnormal patterns. The types of alert signals include
1. Cells below 35 fL.
2. Cells between the lymphocyte and mononuclear cell region. Lymphocytes that are larger than normal, such as variant lymphocytes, certain blast forms, plasma cells, or, in some cases, eosinophilia and basophilia, can trigger an alert.
3. Cells between the mononuclear and granulocyte populations; an increase in IGs or other abnormal cell populations, such as certain types of blasts and eosinophils.
4. Cells to the far right region of the curve, usually a high absolute granulocyte count.
5. An abnormality detected at exactly the 35-fL threshold.
6. A significant increase in the mononuclear population.
7. A multiple alert, when more than one of these regions is affected.
In AcV differential technology, there is a correlation of signals to DiffPlot populations (Figs. 27.12 and 27.13). Lymphocytes are typically small with a regular shape. They are smaller in volume and lower in absorbance than the other cells and are positioned in the lower part of the DiffPlot. Neutrophils will absorb light depending on the presence of cytoplasmic granules and segmented nuclei.


Platelet Histograms
Platelet counting and sizing in both the electrical impedance and optical systems reflect the native cell size. In the electrical impedance method, counting and sizing take place in the RBC aperture. In the optical system, forward light scatter pattern discrimination between erythrocytes and platelets in the flow cell determines the platelet count and frequency distribution.
In the electrical impedance system, the analyzer’s computer classifies particles that are greater than 2 fL or less than 20 fL as platelets. In optical systems, the cell pulse area is determined. The raw data from either the RBC aperture or forward light scatter are sorted. These raw data histograms are then smoothed and tested against mathematical criteria that eliminate nonplatelet particles and are finally fitted to a log-normal distribution curve in the impedance method. This distribution curve has a range of 0 to 70 fL. The final platelet count is derived from the integrated area under this best-fit log-normal curve (Fig. 27.14).

The expected cell coincidence error (more than one cell passing through the aperture at the same time) is corrected based on mathematical probability. In the Coulter models, a minimum of 400 particles per aperture must be detected and evaluated. If an insufficient number of particles are present in the 2- to 20-fL range, a no-fit condition is reported. The data for the size distribution histogram are taken from three sensing channels in this system. This method additionally creates three curves and compares the counts. All three must agree statistically. If any inconsistency exists, an alert results. An alert is also generated if the results are not within the range of 3 to 15 fL.
Particles within the platelet size range can interfere with the platelet count and histogram. Small particles, such as bubbles or dust, can overlap at the low end of the histogram. Microcytic erythrocytes can interfere at the upper end. However, the curve-fitting process attempts to eliminate interference at the upper and lower ends to obtain a correct platelet count. If the histogram does not return to the baseline at both the right and the left of the peak, either there is severe thrombocytopenia or nonplatelets are being counted. Either erythrocyte or leukocyte fragments may be responsible. In
such cases, the platelet count and derived parameters of MPV and PDW are not reliable.
such cases, the platelet count and derived parameters of MPV and PDW are not reliable.
Derived Platelet Parameters
Platelet size has been measured for more than a decade by either micrometry or flow cytometry methods. However, sizing information from data obtained from whole blood specimens and the application of computer technology now make it possible for additional parameters to be generated instrumentally. The Coulter models systems yield the additional parameters of MPV and PDW. These parameters are derived from the platelet histogram and allow for a size comparison between a patient’s specimen and the normal population’s. Size comparisons are useful as an indicator of certain disorders.
Mean Platelet Volume Calculation
The MPV is a measure of the average volume of platelets in a sample. The MPV is analogous to the erythrocytic MCV. It is derived from the same data as the platelet count. In ethylenediaminetetraacetic acid (EDTA)–anti-coagulated blood, platelets undergo a change in shape. This alteration (swelling) causes the MPV to increase approximately 20% during the first hour. After this time, the size is stable for at least 12 hours; however, MPV values should be based on specimens that are between 1 and 4 hours old.
In healthy patients, there is an inverse relationship between platelet count and size (Fig. 27.15). The volume increases as the platelet count decreases. Because of this inverse relationship, the MPV and the platelet count must be considered together. This relationship between the platelet count and MPV is illustrated as a graph, the MPV nomogram, and is used to determine whether a patient’s MPV is normal. The distribution of platelet size is generally a right-skewed, single peak.
No single normal range exists. Patients with a lower platelet count normally have a higher MPV, and patients with a higher platelet count have a lower MPV. Analysis of a nomogram demonstrates that an MPV between 9.0 and 9.8 fL is in the normal range, if the platelet count is normal. MPVs from 7.8 to 8.9 fL or from 9.9 to 12.0 fL may be in the normal range, depending on the platelet count.

Disorders of Mean Platelet Volume
Various disorders are associated with altered MPV values (Table 27.7). The MPV is often decreased in aplastic anemia, in megaloblastic anemia, or as the result of chemotherapy. Hypersplenism is associated with an MPV that is inappropriately low for the platelet count. In septic thrombocytopenia,
the nomogram varies as thrombocytopenia develops, with the MPV rising as the platelet count falls. Platelet destruction associated with disseminated intravascular coagulation causes an increase in the MPV proportional to the severity of thrombocytopenia. The MPV is often increased in patients with myeloproliferative disorders or heterozygous thalassemia.

Platelet Distribution Width
The PDW is a measure of the uniformity of platelet size in a blood specimen. This parameter serves as a validity check and monitors false results. A normal PDW is less than 20%.
The PDW is a measure of the uniformity of platelet size in a blood specimen. This parameter serves as a validity check and monitors false results. A normal PDW is less than 20%.
The PDW can be increased in aplastic and megaloblastic anemias, in chronic myelogenous leukemia, and as the result of antileukemic chemotherapy. The causes of increased PDW are not known but are probably related to dysfunctional megakaryocytic development. Falsely elevated results can be caused by extraneous particles, such as erythrocyte fragments, which broaden the platelet volume distribution beyond that of actual platelet’s.
LASER TECHNOLOGY
Some systems use the principle of flow cytometry based on differential light scattering and cytochemistry. Three distinct steps are involved in its function:
1. Cytochemical reactions prepare the blood cells for analysis.
2. A cytometer measures specific cell properties.
3. Algorithms convert these measurements into familiar results for cell classification, cell count, cell size, and hemoglobinization.
The instrument’s sampling mechanism divides blood samples into aliquots that are treated in four separate reaction chambers:
1. Hemoglobin
2. Red cell/platelet
3. Peroxidase
4. Basophil/lobularity or nuclear channel
Red Blood Cells/Platelets
The RBC/platelet channel uses a laser-based optical assembly that is shared with the basophil/lobularity channel. A buffered reagent isovolumetrically spheres and fixes RBCs and platelets. The light scattered at low and high angles simultaneously measures RBC volume (size) and optical density (hemoglobin concentration) of each cell. The signal pairs are transformed by a computer into a cytogram and two histograms (Fig. 27.16).

Additional parameters (see Chapter 5 for a full discussion of RBC parameters) obtained from the histograms are MCV and the RDW (reference range, 10.2% to 11.8%). Based on the hemoglobin concentration of each cell, the cellular hemoglobin concentration mean (CHCM) is determined. The hemoglobin distribution width (HDW) is determined. The HDW is the SD of the hemoglobin concentration histogram. Hematocrit, MCH, and MCHC are calculated from the measured hemoglobin, RBC count, and MCV. The red cell cytogram enables simultaneous observation of cell volume and hemoglobin concentration.
The platelet histogram (Fig. 27.17) is derived from measurements made with the high-angle detector. The MPV is the mode of the measured platelet volumes.

Peroxidase
In this tungsten light–based optics channel, RBCs are lysed and WBCs are fixed and then stained. A dark precipitate forms in the primary granules of leukocytes containing peroxidase when a chromogen is added with hydrogen peroxide as the substrate. Eosinophils and neutrophils are strongly positive and monocytes are weakly positive. Peroxidase is not present in basophils, lymphocytes, blasts, or LUCs.
Thousands of cells are characterized by a combination of their size (scatter) and peroxidase activity (absorbance) (Fig. 27.18). Scatter is plotted on the y-axis and absorption on the x-axis. Each cell is represented by a dot. The position of the dot is dependent on the combination of the light scattered and absorbed by each cell. The clusters of dots that are generated are defined and analyzed, the number of cells in each is counted, and the cells are classified based on information stored in the computer. This information is used to generate the total WBC count and differential count, except for basophils. The relative percentages and absolute values of leukocytes are included. The parameter mean peroxidase index (MPXI), the index of the mean peroxidase activity of neutrophils as measured by their stain intensity, is generated. Increased myeloperoxidase activity may be associated with megaloblastic anemia, hyperproliferative granulopoiesis, or reactive states. Increased numbers of LUCs may indicate the presence of blasts or abnormal lymphocytes. The reference ranges of 0% to 3.7% for LUCs and 0% to 5.4% for HPX have been established.

Basophil/Lobularity (Nuclear) Channel
The nuclear channel is used to measure the conformation of the nucleus of WBCs. The principle of the reaction in this channel is that when white blood cells are exposed to a surfactant at a low pH, the membranes and cytoplasm of specific leukocytes, neutrophils, eosinophils, lymphocytes, and monocytes disintegrate and only the bare nuclei remain.
The nuclear channel is used to measure the conformation of the nucleus of WBCs. The principle of the reaction in this channel is that when white blood cells are exposed to a surfactant at a low pH, the membranes and cytoplasm of specific leukocytes, neutrophils, eosinophils, lymphocytes, and monocytes disintegrate and only the bare nuclei remain.
The nuclear channel cytometer distinguishes leukocytes by differences in nuclear shape and counts basophils. This laser-based cytometer measures light scattering at two different angles, low (0° to 5°) and high (5° to 15°). Low-angle scatter measures size, and the low-angle scatter of intact basophils is much greater than the bare nuclei of other leukocytes. A fixed horizontal threshold separates basophils from the nuclei of other leukocytes (Fig. 27.18). High-angle scatter is responsive to the lobularity of nuclei. The more lobulated the nuclei, the larger the high-angle signal.
On the cytogram, polymorphonuclear neutrophil (PMN) appear on the right and mononuclear nuclei (MN) appear on the left with a valley between them. A vertical threshold separates the two clusters. The ratio of PMN:MN, the lobularity index (LI), is an index of the degree of PMN nuclear segmentation; a low value suggests a left shift. Blast cells appear to the left of the normal mononuclear cells on the x-axis and are counted for flagging purposes. (A system of flags for abnormal morphology alerts the instrument operator that additional work, such as microscopic examination of the blood, may be required.) Nucleated RBCs, if present, appear within the PMN cluster.
Lymphocyte Subtyping
An immunoperoxidase reaction is used for lymphocyte subtyping (Fig. 27.19). A specific monoclonal antibody is first reacted with whole blood. A second biotinylated antibody, which binds only to the monoclonal antibody, is added, followed by an avidin-peroxidase reagent. Peroxidase is used as a stain, using a similar method to that of the peroxidase channel. Lymphocytes, which have been labeled by the immunoperoxidase reaction, appear between the unlabeled lymphocyte population and the monocytes. Cells with endogenous peroxidase such as neutrophils stain intensely and appear far to the right.

APPLICATIONS OF FLOW CYTOMETRY
The introduction of the fl ow cytometer into the clinical laboratory is a major technological advance. Flow cytometry is a field that has evolved rapidly during the past three decades. Instruments based on the fl ow cytometry principle were initially designed to count and size cells. Later modifications were designed to perform differential leukocyte counts by identifying specific cytochemical reactions in the cells. The current types of fl ow cytometry instruments can analyze cells for many constituents and sort cells into subpopulations (Fig. 27.20).

General Properties of Flow Cytometry
Most flow-cell instruments can simultaneously analyze multiple parameters at the rate of 5,000 to 10,000 cells/seconds. The cellular analysis yields quantitative data about the chemical and physical properties of individual cells, and after analysis, cells can be physically separated into subpopulations for further study at the rate of 5,000 cells/seconds. The major advances in this technology are owing to several factors:
1. The ability to produce monoclonal antibodies resulted in the subsequent development of specific surface markers for various subpopulations of cells.
2. The development of new fluorescent probes for DNA, RNA, and other cellular components increased the variety of possible applications at the molecular and cellular level.
3. The expansion of computer applications has improved the instrumentation technology, making it easier to operate and more practical for use in clinical as well as research laboratories.
Hematological Applications
Flow cytometry can be applied practically to several techniques in the clinical hematology laboratory. These applications include automated leukocyte differentiation and reticulocyte enumeration.
Automated Differentials
Automated differentials can be based on a variety of principles. These include determination of cell volume by electrical impedance or forward light scatter, cytochemistry or peroxidase staining, and VCS technology. Evaluation of internal cellular organelles and nuclear characteristics can be by
■ 90° laser scatter
■ Polarizing laser light
■ RF
Separate measurements can be made of individual measurements of volume, conductivity, and light scatter. An additional method is to integrate the three in VCS technology into a three-dimensional (3D) leukocyte analysis. The volume aspect is by volumetric sizing by impedance and RF opacity for internal composition. In addition, helium-neon laser light scatter is applied so that laser light can produce scattering characteristics of each cell at different angles for granularity and nuclear structure.
In addition, different reagents can be used to lyse certain cells. Different types of technologies are used by instrument manufacturers to produce an automated leukocyte differential. These include:
Beckman-Coulter: VCS
Abbott: MAPPS—0°, 90°, 10°, 90° depolarized
Roche (Sysmex): RF, DC
Siemens Healthcare Diagnostics (formerly Bayer and Technicon): peroxidase staining; optical scatter and absorption; basophils: differential lysis laser scatter high and low
Clinical Applications of Flow Cytometry
Because single-cell suspensions of peripheral blood and bone marrow are easy to obtain, most clinical applications of flow cytometry are in the specialties of hematology and immunology. A number of instruments are currently manufactured for various uses (Table 27.8).

Counting Reticulocytes and Platelets
Reticulocytes
Manual counting of reticulocytes has been conducted since the 1940s. It is tedious and time-consuming and analyzes fewer erythrocytes than do flow cytometry systems. Enumeration of reticulocytes by flow cytometry is more accurate, precise, and cost-effective than manual counting. Flow cytometry also provides additional reticulocyte parameters of the IRF, or reticulocyte maturity index (RMI), and the measurement of reticulocyte maturity.
Reticulocytes can be counted by using a stain for residual RNA in erythrocytes (e.g., new methylene blue, thiazole orange, and oxazine 750); proprietary fluorescent dye CD4K530 is used by one manufacturer. The Coulter system uses neomethylene blue and sulfuric acid as reagents.
In addition, fully automated flow cytometers specifically designed for reticulocyte enumeration by optical light scatter have been incorporated into existing hematology analyzers (see Table 27.8).
Platelets
Measurement of platelets provides an estimate of young, reticulated platelets by counting platelets that stain with an RNA dye (e.g., thiazole orange or coriphosphine-O). Platelets in whole blood are also labeled with PE-conjugated CD41 antibody to distinguish them from other small particles. CD-41–positive platelets are evaluated for RNA content. The finding of elevated reticulated platelets indicates “stress” platelets from increased bone marrow production and is consistent with a diagnosis of immune thrombocytopenic purpura.
Other platelet assays include platelet surface receptor quantitation and distribution for the diagnosis of congenital platelet function disorders, platelet-associated immunoglobulin G (IgG) quantitation for the diagnosis of immune thrombocytopenias, and platelet cross-matching for transfusion. Other assays include fibrinogen receptor occupancy studies for monitoring the clinical efficacy of platelet-directed anticoagulation in thrombosis. Detection of activated platelet surface markers, cytoplasmic calcium ion measurements, and platelet microparticles for the assessment of hypercoagulable states can be performed.
Other Cellular Applications
Flow cytometry applications are extended to various areas of specialized study.
Immunophenotyping
Monoclonal antibodies, identified by a cluster designation (CD), are used in most flow cytometry immunophenotyping (Fig. 27.21; Table 27.9). Cell surface molecules recognized by monoclonal antibodies are called antigens because antibodies can be produced against them or markers because they identify and discriminate between (“mark”) different cell populations. Markers can be grouped into several categories. Some are specific for cells of a particular lineage (e.g., CD4+ lymphocytes) or maturational pathway (e.g., CD34+ progenitor stem cells), and the expression of others varies according to the state of activation or differentiation of the same cells.


Measuring T Cells for Acquired Immunodeficiency Syndrome Analysis
The quantitation of T and B cells using monoclonal surface markers can be performed using flow cytometry. With the flow cytometer, 10,000 cells can be assayed into subsets in 1 minute with multiparameter analysis. Through the use of monoclonal antibodies, T- and B-cell populations can be divided into subpopulations with specific functions. For example, T cells are divided into two functional subpopulations, T-helper (TH) and T-suppressor (TS) cells. Normal individuals have a TH/TS ratio of 2 to 3:1. This ratio is inverted in certain disorders and diseases. These conditions include the acute phase of cytomegalovirus mononucleosis, subsequent to bone marrow transplantation, and acquired immunodeficiency syndrome (AIDS).
The quantitation of T and B cells using monoclonal surface markers can be performed using flow cytometry. With the flow cytometer, 10,000 cells can be assayed into subsets in 1 minute with multiparameter analysis. Through the use of monoclonal antibodies, T- and B-cell populations can be divided into subpopulations with specific functions. For example, T cells are divided into two functional subpopulations, T-helper (TH) and T-suppressor (TS) cells. Normal individuals have a TH/TS ratio of 2 to 3:1. This ratio is inverted in certain disorders and diseases. These conditions include the acute phase of cytomegalovirus mononucleosis, subsequent to bone marrow transplantation, and acquired immunodeficiency syndrome (AIDS).
The CD4 (helper subset) T-lymphocyte cell count is one of the standard measures for diagnosing AIDS and the management of disease progress in patients with human immunodeficiency virus (HIV) disease. The analysis of the T cell and B cell ratio is clinically useful in evaluating the immune system status of patients who may be at an increased risk of opportunistic infections. In addition, the absolute number of CD4+ lymphocytes is reflective of the degree of immune deficiency in HIV-infected individuals and may be used as a guide for timing the institution of antiretroviral therapy as well as monitoring the level of immune reconstitution following initiation of therapy.
In these cases, two cell-surface antigens—CD3, which is present on mature T lymphocytes, and CD4, which is only present on the helper subset of T lymphocytes—are used. The percentage of CD4 lymphocytes is determined by using a fluorochrome-conjugated CD3 antibody (e.g., FITC-CD3) together with a CD4 antibody conjugated to a second fluorochrome (e.g., PE-CD4). The absolute CD4 count can be determined by a single-platform method, which uses a sample spiked with a predetermined number of beads per unit volume to index the CD4 count comparatively. A second approach is a dual-platform method. The absolute count of CD4-bearing lymphocytes is calculated by multiplying the percentage of CD4-bearing lymphocytes by the absolute lymphocyte count (calculated independently from the total leukocyte count and percent of lymphocytes in a peripheral
blood smear differential).
The absolute number of CD4 lymphocytes is reflective of the degree of immune deficiency in HIV-infected patients and may be used as a guide for timing the administration of antiretroviral therapy as well as monitoring the level of immune reconstitution following initiation of therapy.
Basic Lymphocyte Screening Panel
A basic immune screening panel typically consists of detection and quantitation of CD3, CD4, CD8, CD19, and CD16/56. Anti-CD45/CD14 is included to assist in distinguishing lymphocytes from monocytes. This panel reveals the frequency of T cells (CD3+), B cells (CD19+), and natural killer cells (CD3-, CD16+, CD56+). It also provides the frequency of TH-inducer cells (CD3+, CD4+) and T-suppressor/cytotoxic cells (CD3+, CD8+).
Typical ranges for lymphocyte subset percentages in adult donors are CD3, 56% to 86%; CD4, 33% to 58%; CD8, 13% to 39%; CD16+ CD56, 5% to 26%; and CD19, 5% to 22%.
It does not provide information on cell activation or signaling pathway receptors, frequency of T subsets (e.g., Th1 or Th2), stem or blast cells, B lymphocytes (e.g., immunoblasts or plasma cells), or nonlymphoid elements.
Hematological Malignancy
Flow cytometry has become an important tool in the diagnosis and classification of hematologic neoplasia by immunophenotyping. Numerous, well-characterized antibodies and their various combinations used in flow cytometry allow for rapid, reliable identification and characterization of these neoplasms.
Intracellular staining is most often used to aid in the diagnosis of acute leukemias and lymphomas as an adjunct to surface antigen detection. For these assays, multiple cell-surface and intracellular antigens may be studied simultaneously. Three or four antibodies are used simultaneously; each one is conjugated to a unique fluorochrome to characterize the cells in each tube. This technique is referred to as three-color or four-color immunophenotyping. Examples of commonly used antibodies in hematopathology (Table 27.10) are CD3, CD13, CD22, myeloperoxidase (MPO), terminal deoxynucleotidyl transferase (TdT), and cytoplasmic immunoglobulins (kappa and lambda light chains, M heavy chain).
Research applications of immunocytochemistry (IC) immunophenotyping include IC cytokine expression to examine functional subtypes of lymphocytes in acquired and primary immunodefi ciencies and to measure engraftment success after a transplant procedure. Detection of cancer-related markers in tumors as prognostic indicators (e.g., estrogen and progesterone receptors, oncoproteins, p53) is an additional application.
DNA Ploidy and Cell Cycling
One of the earliest clinical applications of flow cytometry was the detection of aneuploidy and cell cycling status of solid tumors, particularly selected breast tumors. Since 1996, the use of DNA analysis has significantly decreased. It is now most often performed in patients with node-negative breast cancer and other tumors in which the clinical correlation prognostic significance is strongest. Recent technological innovations may lead to a revival of interest in clinical DNA analysis.
Because approximately a 2-week lag exists between bone marrow activity and its resultant expression in the peripheral blood, it is important to assess the current status of the bone marrow cells under certain conditions (i.e., cell cycle kinetics). Flow cytometry allows for analysis of the bone marrow cell cycle parameters with no time lag.
Flow cytometry techniques with bone marrow cells are applicable to DNA cell cycle analysis, which quantitates the number of cells in various phases of the cell cycle (Fig. 27.22). The cell cycle stage is important in drug therapy. Antineoplastic drugs exhibit specificity for different phases of the cell cycle. Inhibitors of microtubule function affect cells in M phase; glucocorticoids inhibit cells in G1; antimetabolites and folate pathway inhibitors inhibit cells in S phase; antitumor antibiotics inhibit cells in G2; topoisomerase inhibitors inhibit cells in S phase and G2. Alkylating agents and platinum complexes affect cell function in all phases and are therefore cell cycle nonspecific. Different cell cycle specificities allow various drug classes to be used in combination to target different populations of cells. Specific drugs can be administered to target actively replicating neoplastic cells, and nonspecific agents can be used to target nonreplicating neoplastic cells.

Solid Organ Transplantation
Flow cytometric cross-matching uses fluorochrome-conjugated antihuman IgG to detect the binding of alloantibodies to donor lymphocytes in allogeneic organ transplantation. CD3 and CD19 coupled with anti-IgG in a three-color assay can distinguish T-lymphocyte and B-lymphocyte mismatches. Patient serum can be screened against known HLA antigens for the detection of corresponding antibodies.
Stem Cell Transplantation
Flow cytometry is widely used to enumerate the CD34-positive implanted stem cells. In some cases, CD45 and nucleic acid stains are also detected. In bone marrow transplantation, flow cytometry applications can include pretransplantation determinations of the efficacy of ex vivo T cell graft depletion, posttransplantation evaluation of immune recovery, graft rejection, graft versus host disease, and the graft versus leukemia effect.
Monitoring Monoclonal Antibody Therapy
In conjunction with IC and molecular techniques, flow cytometry has been essential for measuring the expression of cell surface and intracellular markers of multiple drug resistance (MDR) in cancer patients, assessing the intracellular accumulation and efflux of chemotherapeutic drugs and studying the other mechanisms leading to MDR. Ligand, antigen, or molecule-targeted biologic therapy using
monoclonal antigens (e.g., myelotarg [CD33] and rituximab [CD20] for some leukemias) is the most rapidly growing area of pharmacology. In some cases, these agents work by directly disrupting cell proliferation and antiapoptosis by clocking the cell membrane receptors and circulating ligands associated with signal transduction. Others serve as the targeting system for other cytotoxic products. The first of this new class of pharmaceutical agents was anti-CD3.
More recently, monoclonal antibodies directed against
CD20, CD25, CD33, CD45, and CD52 have been developed. Before treatment, flow-cell analysis is critical for confirming that the antigen is expressed by the offending cells. During and after treatment, flow cytometry is used to verify binding of the antibody and to monitor the efficacy of tumor cell eradication.
CD20, CD25, CD33, CD45, and CD52 have been developed. Before treatment, flow-cell analysis is critical for confirming that the antigen is expressed by the offending cells. During and after treatment, flow cytometry is used to verify binding of the antibody and to monitor the efficacy of tumor cell eradication.
Paroxysmal Nocturnal Hemoglobinemia Testing
The detection of paroxysmal nocturnal hemoglobinemia (PNH) by the traditional methods of Ham’s (acid hemolysis) and the sucrose lysis test has been replaced in many clinical laboratories by flow cytometry analysis. The glycosyl phosphatidyl inositol (GPI)-linked proteins, CD55 and CD59, are examined to determine if a deficiency or absence of these cell surface markers exists. If a deficiency or absence of CD55 and CD59 is established, the condition is diagnostic of PNH.
Fetal Hemoglobin
Detection of fetal hemoglobin and F cells by flow cytometry is becoming common. The assay uses monoclonal antibodies to hemoglobin F. This analysis allows for the detection of a variety of diseases including sickle cell disease and fetalmaternal hemorrhage. In addition, this methodology allows for quantitation of fetal hemoglobin.
Blood Parasites
Malarial parasites can be screened by flow cytometry methods. If erythrocytes are stained with acridine orange, the mature erythrocytes containing no DNA do not fluoresce with this stain. However, malarial erythrocytes contain DNA and thus will fluoresce.
Cell Functioning Analysis
Every event that occurs during the process of lymphocyte activation can be measured by flow cytometry. The measurements with the greatest clinical significance include tyrosine phosphorylation, calcium flux, oxidative metabolism, neoantigen expression, and cellular proliferation.
Flow cytometry measurement of the oxidative burst in neutrophils has been used as a screening test for chronic granulomatous disease (CGD).
Chromosomal Analysis
Flow cytometry can be used for karyotyping analysis. A chromosomal histogram consists of seven peaks that represent the different groups of chromosomes. By evaluating the peaks, various disorders can be diagnosed.
Cell Sorting
Some flow cytometers have additional hardware that allows them to act as cell sorters. After quickly making the appropriate measurements, the computer makes the decision to sort or isolate a single cell by applying a charge to that cell just as it leaves the flow cell. The cell is electrostatically deflected into a test tube. Any cell type can be sterilely sorted and recovered alive based on any combination of light scatter and fluorescence measurements. The cell type of interest can be separated from a complex mixture of cell types even though it may be an extremely rare or minor subpopulation.
DIGITAL MICROSCOPY
Recent advances in artificial neural networks (ANNs), image analysis, and slide handling have combined to produce instruments that automate manual differentials in new ways. This new technology, referred to as automated digital cell morphology (Fig. 27.23), provides an unprecedented level of efficiency and consistency. In its simplest form, automated digital cell morphology is a process where blood cells are automatically located and preclassified into categories of blood cells. Images of these cells are retained for confirmation by a technologist and can be shared electronically and stored as digital images. This adaptability allows for future review and comparisons by laboratory professionals and physicians.

Artificial Neural Networks
An ANN is an information-processing model that simulates the way the human brain processes information. ANN emulates the neural structure of the brain, which is composed of a large number of highly interconnected processing elements (neurons) working together to solve specific problems. ANNs have been around since the 1940s, but it was not until the mid-1980s that algorithms became sophisticated enough and computers powerful enough for general applications to develop.
Digital Cell Morphology
New hardware and the development of databases have aided in developing image analysis systems that can finally meet the demands of the hematology laboratory. The most dramatic change in microscopy over the last three decades is the ability to digitize image specimens and transmit these images electronically for remote analysis. This capability is now called virtual microscopy.
In 2000, CellaVision (Lund, Sweden) launched the DiffMaster Octavia. The system consists of an automated microscope with a 100× objective; a stepper motor and light control unit; and a progressive three-chip CCD color camera connected to a computer with software for localization, segmentation, and classification of white and RBCs. The system processes eight slides per batch, utilizing a slide holder. It allows for remote review of a smear and storage of up to 20,000 slides with images in a database.
In comparison with earlier attempts by other manufacturers, the DiffMaster Octavia handles wedged smears stained according to the Wright, Wright-Giemsa, or May Grünwald–Giemsa staining protocols and uses ANNs trained on a large database of cells. It was the first image analysis system to
locate and preclassify cells into 15 different categories and automatically precharacterize six RBC morphologic characteristics. The platelet estimates and erythrocyte precharacterization are performed in an overview image corresponding to eight high-power fields (100×). Review and release of results
can be done remotely.
INSTRUMENTS IN COAGULATION STUDIES
In 2003, seven different manufacturers produced 33 laboratory-based coagulation analyzers, many of which are capable of performing clottable, immunoassay, and chromogenic assays (Table 27.11). The diffi culty with some instruments is that many of them are unable to transmit an industry-standard test identifier (LOINC code) to the host laboratory information system (LIS).


Various models are available in a wide range of prices designed for different size laboratories. Each instrument offers unique advantages (e.g., high throughput, reduced reagent volume, integral bar-code reader, cap piercing, or automatic sample predilution). Many instruments offer userprogrammable methods and preprogrammed methods.
Suggested screening panels include thrombotic hemostasis panel (Box 27.2) and a fibrinolytic hemostasis panel (Box 27.3).
BOX 27.2
Thrombotic Hemostasis Panel AssaysAntithrombin
Factor VIII:C
Heparin
Lupus anticoagulant
Protein C
Protein S and free protein S
Factor VIII:C
Heparin
Lupus anticoagulant
Protein C
Protein S and free protein S
BOX 27.3
Fibrinolytic Hemostasis Panel Assaysa-2-Antiplasmin
Plasminogen
Plasminogen activator inhibitor
Tissue plasminogen activator
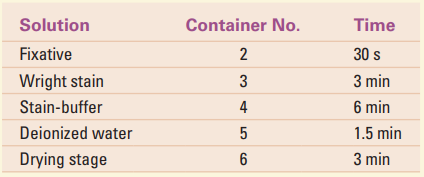
Plasminogen
Plasminogen activator inhibitor
Tissue plasminogen activator
Electromechanical Methods
The earliest instruments to detect blood clotting were developed between 1920 and 1940. These instruments were based primarily on detection of the formation of a fibrin clot and replaced visual observation of the formation of a fibrin clot in a test tube. By the mid-1960s, electromechanical instruments were in widespread use. In the 1970s, photo-optical methods replaced electromechanical devices in most laboratories, except student laboratories or as a backup method in routine laboratories.
The principle of electromechanical methodology is the measurement of conduction or impedance of an electrical current by the formation of fibrin. An example of such a semiautomated instrument is the fibrometer. This system consists of a 37°C heat block, an automatic pipette, and a mechanical mixer and timer block.
After the appropriate containers are filled and plasma samples and thromboplastin substrate are incubated, plasma is added to the substrate to initiate the timing mechanism. This timing mechanism triggers a digital readout time and the probe unit. The probe arm holds two electrodes. When in operation, it drops down and allows the electrodes to fall into place within the reaction well containing the plasmathromboplastin mixture. The stationary probe does not move when the instrument is in operation but functions in conjunction with the moving electrode. This stationary electrode is responsible for creating an electrical potential between it and the moving electrode. The moving electrode is located in front of the stationary electrode in the probe arm. When a test is being performed, this electrode cycles through the plasmathromboplastin mixture every half second until a clot forms. A detection circuit is activated when a fibrin strand is formed between the two electrodes, thus completing the circuit. Circuit activation stops the timer and prevents further movement of the moving electrode. Electromechanical methods, such as the fibrometer, can be used for various coagulation assays. These include activated partial thromboplastin time (APTT), prothrombin time (PT), and factor assays.
A new generation of PT point-of-care testing is the HEMOSENSE INRatio (Milpitas, CA). This handheld instrument (Fig. 27.24) provides the PT and corresponding international normalized ratio (INR) value by measuring the electrical impedance using fresh capillary whole blood. The INR system performs a modified version of the one-stage PT test. The clot formed in the reaction is detected as a change in the electrical impedance of the blood sample that occurs when fibrinogen is converted into fibrin. The test strip itself consists of layers of transparent plastic, one of which is an
electrode layer (Fig. 27.25).


Photo-Optical Methods
The principle of photo-optical measurement is that a change in light transmission measured as optical density (absorbance) versus time can be used to quantitatively determine the activity of various coagulation stages or factors. Photooptical clot detection systems can be used for the determination of a wide variety of assays (e.g., APTT, PT, fibrinogen levels, and thrombin time). Quantitative factor assays based on the APTT (factors VIII, IX, XI, and XII) and quantitative factor assays based on the PT (factors V, VII, and X) are examples of available assays.
The principle of photo-optical measurement is that a change in light transmission measured as optical density (absorbance) versus time can be used to quantitatively determine the activity of various coagulation stages or factors. Photooptical clot detection systems can be used for the determination of a wide variety of assays (e.g., APTT, PT, fibrinogen levels, and thrombin time). Quantitative factor assays based on the APTT (factors VIII, IX, XI, and XII) and quantitative factor assays based on the PT (factors V, VII, and X) are examples of available assays.
These microprocessor-controlled instruments have separate detector cells with their own red light–emitting diode (LED) light source, which is driven by a constant current regulator to give each a noise-free light beam. The light beam passes through a cuvette, where it is altered by fibrin clot formation. The light beam then passes through a diffuser and falls on the sensor, which instantly converts the transmitted light into an electrical signal. An amplified signal is converted to a digital value for further processing. The computer-processed results are subsequently sent to the
visual display monitor and printer.
A system is ready for operation when the temperature indicator reads 37 ± 1°C. Preprogrammed modes select the test parameters for each test method, which determines the proper volumes of specimen and reagents. The appropriate amounts of reagents are placed in the specific reagent storage wells. Pressing the start button initiates the test cycle. The optical density (absorbance) of the reaction mixture is then monitored until the rate of change exceeds a predetermined level for a defined period, indicating the presence of a fibrin clot end point. The time (in seconds) of the end point is stored and may be printed or displayed on demand at the end of each series of determinations.
Quality control in these systems includes automatic selfchecking of the optical system and the storage of standard and assay curves. A coeffi cient of determination can be used to check precision.
In addition to routine clot testing, newer instruments offer chromogenic channel models to automate the growing range of specialized diagnostic tests in coagulation.
Viscosity-based Detection System
Viscosity is defined as the resistance that a material has to avchange in its form. If this principle is used as a mechanism for clot detection, the natural thickening (viscosity) is monitored by the motion (amplitude of an oscillating steel ball in a specially designed cuvette) as a change in form takes place. The final result is accurate and is insensitive to colored plasma, lipemic plasmas, bilirubin, or turbid reagents and reliable measurement for the hemostasis laboratory. Diagnostica Stago manufactures an instrument based on this principle. The steps in the viscosity-based detection system (VDS) are
1. Movement of the steel ball is triggered by two activating coils, working alternately to induce and maintain a natural oscillation.
2. When the start reagent is added, the detection starts immediately.
3. When the ball starts oscillating left and right, a chronometer (clock) begins to time the clotting of the sample.
4. As the ball oscillates left and right, the amplitude or motion is also measured. A peak is formed when the ball is detected in the center of cuvette.
5. Amplitude is monitored during the entire clotting process.
6. As the clot appears, the viscosity increases, and the amplitude decreases.
7. Based on different algorithms, the chronometer is stopped even if the clot is peak, and/or the ball is still in motion.
Platelet Agglutination
The ristocetin cofactor assay measures the ability of a patient’s plasma to agglutinate formalin-fixed platelets in the presence of ristocetin. The rate of ristocetin-induced agglutination is related to the concentration of von Willebrand factor, and the percent normal activity can be obtained from the standard curve. Patient values are determined by comparison to a standard curve, allowing quantitation of percent ristocetin cofactor activity.
The ristocetin cofactor assay measures the ability of a patient’s plasma to agglutinate formalin-fixed platelets in the presence of ristocetin. The rate of ristocetin-induced agglutination is related to the concentration of von Willebrand factor, and the percent normal activity can be obtained from the standard curve. Patient values are determined by comparison to a standard curve, allowing quantitation of percent ristocetin cofactor activity.
Platelet Aggregation
Most platelet aggregation procedures are based on some variation of Born method. Agents such as adenosine diphosphate (ADP), collagen, epinephrine, snake venom, thrombin, and ristocetin can also be used to aggregate platelets.
Most platelet aggregation procedures are based on some variation of Born method. Agents such as adenosine diphosphate (ADP), collagen, epinephrine, snake venom, thrombin, and ristocetin can also be used to aggregate platelets.
The principle of the test is that platelet-rich plasma is treated with a known aggregating agent. If aggregated, clou diness or turbidity patterns are determined by photometrically comparing the light transmitted through a suspension of aggregated platelets with that of a suspension of nonaggregated platelets using an aggregometer. The curve that is obtained can be used to assess platelet function.
Primary Response
Primary response is the reversible aggregation of platelets by the aggregating agent. The appearance of a biphasic reaction, showing both primary and secondary response, can occur for some agonists at low concentrations.
Primary response is the reversible aggregation of platelets by the aggregating agent. The appearance of a biphasic reaction, showing both primary and secondary response, can occur for some agonists at low concentrations.
Secondary Response
Secondary response is the result of enhancement of the initial aggregation process caused by the release of endogenous ADP and the formation of thromboxane A2. The secondary response is irreversible.
New Automation
The PFA-100 (Siemens Healthcare Diagnostics) is an automated system that incorporates a high shear fl ow system to simulate the in vivo hemodynamic conditions of platelet adhesion and aggregation as encountered at a vascular lesion. The system evaluates the ability of platelets to occlude an aperture in a biochemically active membrane. Results are reported as closure time (CT). This instrument offers several advantages over traditional aggregometry because it assesses multiple facets of primary hemostasis—adherence, activation, and aggregation.
The PFA-100 (Siemens Healthcare Diagnostics) is an automated system that incorporates a high shear fl ow system to simulate the in vivo hemodynamic conditions of platelet adhesion and aggregation as encountered at a vascular lesion. The system evaluates the ability of platelets to occlude an aperture in a biochemically active membrane. Results are reported as closure time (CT). This instrument offers several advantages over traditional aggregometry because it assesses multiple facets of primary hemostasis—adherence, activation, and aggregation.
SUMMARY
Instrumental Principles
Various principles of cell counting are used in instrumentation. The impedance principle is based on the detection and measurement of changes in electrical resistance produced by a particle as it passes through a small aperture. In the optical principle, the degree of scatter and the amount of light reaching the sensor depend on the volume of the cell. The volume of each cell is proportional to the intensity of the forward scatter of light. In both systems, the number of pulses generated is directly proportional to the number of cells passing through the sensing zone in a specific period.
Based on the original ideas of Einstein and physical theories in the 1950s, laser light was applied to medical and scientific instrumentation. Lasers are able to sort the energy in atoms and molecules, concentrate it, and release it in powerful waves.
Flow-cell cytometry is another method that is applied in the study of cells. The principle of flow cytometry is based on the fact that cells can be stained specifically with a fluorescent dye to identify exact cell types. Laser light is combined with this method in state-of-the-art instrumentation for cell identification and sorting.
Automated instruments that count and/or identify blood cells range from small bench-top units to large sophisticated instruments. The values that an instrument generates are referred to as parameters. The simplest units count erythrocytes, leukocytes, and platelets. The most sophisticated instruments generate many additional parameters. Some instruments are based on a variety of principles including the electrical impedance principle and the optical principle of laser scatter technology. In addition to numerical outputs, the larger instruments are capable of generating graphic displays of the frequency
distributions of erythrocytes, leukocytes, platelets, and histograms. Quality control systems, such as Levey-Jennings charts, are also generated by the larger instruments.
Analysis of Electrical Impedance Instrumental Data Output
Erythrocyte histograms are valuable in determining the similarity of the population of RBCs being tested. Quantitative parameters that express variation in the erythrocyte population are either the RDW or the RCMI. The RDW and MCV can be correlated and classifi ed in various disease categories.
Erythrocyte histograms are valuable in determining the similarity of the population of RBCs being tested. Quantitative parameters that express variation in the erythrocyte population are either the RDW or the RCMI. The RDW and MCV can be correlated and classifi ed in various disease categories.
The graphic display of leukocytes, the WBC histogram, classifies them into three categories: lymphocytes, mononuclear cells or monocytes, and granulocytes. Computer programming allows for the differentiation of leukocytes graphically, in terms of percentage and absolute values.
Platelet histograms, the MPV, and the DPW can be generated by computer-assisted instruments in addition to the platelet count. The MPV is an expression of the measure of the average volume of the platelets in the sample. No single normal value exists for the MPV; however, an inverse relationship exists between the MPV and the platelet count. This relationship is expressed graphically in a nomogram. The PDW is a measure of the uniformity of platelet size. A normal PDW is less than 20%. Increased or decreased values are associated with various categories of disease.
Laser Technology
Some systems are based on the principle of differential lightscattering cytochemistry. Cytochemical reactions prepare the blood cells for analysis, a cytometer measures specific cell properties, and algorithms convert these measurements into cell classification, cell count, cell size, and hemoglobinization.
Some systems are based on the principle of differential lightscattering cytochemistry. Cytochemical reactions prepare the blood cells for analysis, a cytometer measures specific cell properties, and algorithms convert these measurements into cell classification, cell count, cell size, and hemoglobinization.
Applications of Flow Cytometry
Instruments based on the flow-cell cytometry principle were initially designed to count and size cells; later modifications included leukocyte differential analysis. Today, the applications of the technology are highly diverse and include both cellular component identification and cell-sorting capabilities.
Monoclonal antibodies and fluorescent probes have had a major effect on advances in flow cytometry applications. In the hematology laboratory, in addition to leukocyte differentiation, applications can include reticulocyte counting and screening for malarial parasites. Other cellular applications include analysis of the ratio of T cells to B cells in immunodeficiency states such as AIDS, the study of DNA in cell cycle kinetics, and the investigation of chromosomes.
Instruments in Coagulation Studies
Manual methods have been replaced in the clinical hematology laboratory by electromechanical and optical systems. In the electromechanical system, two electrodes work in conjunction with one another. When a fi brin strand forms in the plasmathromboplastin mixture between these two electrodes, a complete circuit is formed. Completion of the circuit automatically stops the timer and the length of the reaction time is displayed.
Manual methods have been replaced in the clinical hematology laboratory by electromechanical and optical systems. In the electromechanical system, two electrodes work in conjunction with one another. When a fi brin strand forms in the plasmathromboplastin mixture between these two electrodes, a complete circuit is formed. Completion of the circuit automatically stops the timer and the length of the reaction time is displayed.
In the optical system, a change in light transmission through the reaction mixture of plasma-thromboplastin is measured as optical density versus time. Formation of a fibrin clot alters the light path, and after the data are processed by the onboard microprocessor, the time in seconds that the reaction took is displayed or printed.
Both methods can measure APTT, PT, factor levels, and various other parameters. The optical systems offer the advantage of internal quality control features. Chromogenic capabilities are also available.
Platelet aggregation procedures are used to test the qualitative response of platelets to various aggregating agents, such as collagen, thrombin, and ristocetin. Turbidity patterns are determined photometrically by comparing the patient’s platelet activity with nonaggregated suspension and normal platelets. A curve is generated using a recordingcspectrophotometer.
Case Studies
Because the relationship between histogram and nomogram information is important to understanding the data output capabilities of modern instrumentation, specific examples become important in establishing a diagnosis and monitoring treatment of a patient. A knowledge and understanding of these newer sources of patient information is important to the clinical laboratory scientist. Each of the cases presented in this chapter represents a fairly typical example of a specific type of disorder.
Because the relationship between histogram and nomogram information is important to understanding the data output capabilities of modern instrumentation, specific examples become important in establishing a diagnosis and monitoring treatment of a patient. A knowledge and understanding of these newer sources of patient information is important to the clinical laboratory scientist. Each of the cases presented in this chapter represents a fairly typical example of a specific type of disorder.
(continue)
Lê Văn Công
Reference: Clinical Hematology 5 Edition - Mary Louise Turgeon
Ủng hộ Labnotes123 để nhóm có kinh phí hoạt động tốt hơn bằng cách đóng góp vào tài khoản:
Lê Văn Công
Vietinbank: 106006076994
Chi nhánh tỉnh Hải Dương

